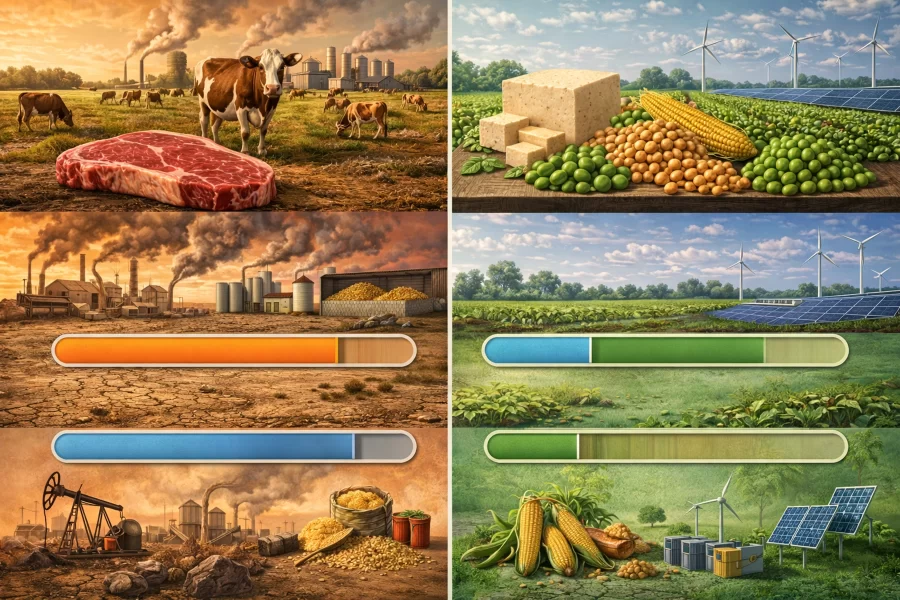
- Beef is the most polluting contender
- Livestock has the highest emissions
- Methane and manure are major problems
- Nitrogen pollution is highest with meat
- Imitation meats have a lower footprint
- Whole-food substitutes are the gentlest option
- Legumes are the most environmentally efficient
- Lab-grown meat depends heavily on energy
- Processing increases the footprint of imitations
- Plant-based alternatives save many emissions
- 100 g of protein does not cost the planet the same
- Protein choice has a major ecological effect
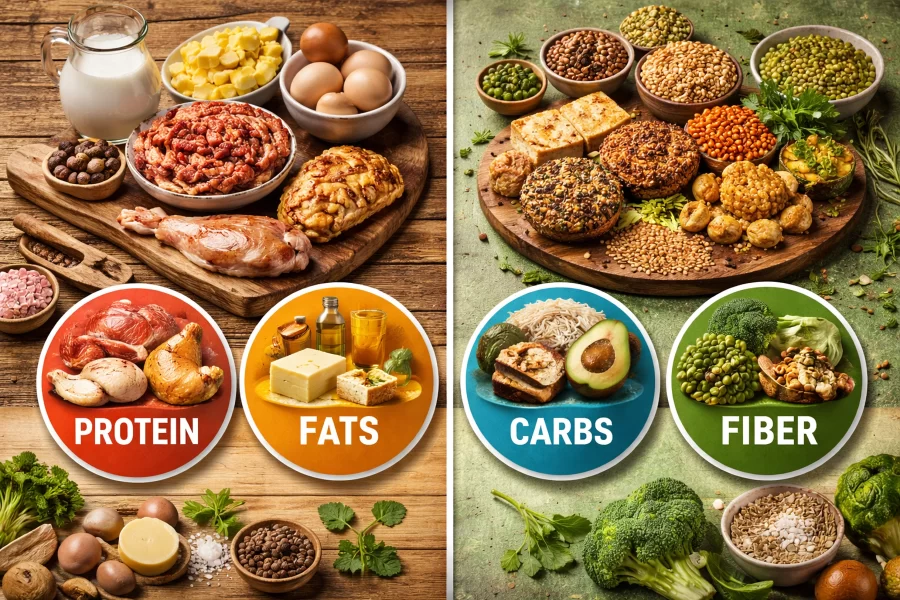
The mission of this site, blog, platform or whatever you would call it is to show us that life and nutrition can exist without meat — or at least without its classic form and origin. In another article, we looked at how this can happen in terms of nutrients and meeting our daily macronutrient needs. We defined four main players on the food field — meat, meat substitutes based on whole foods, meat imitations and the futuristic meat grown in laboratories.
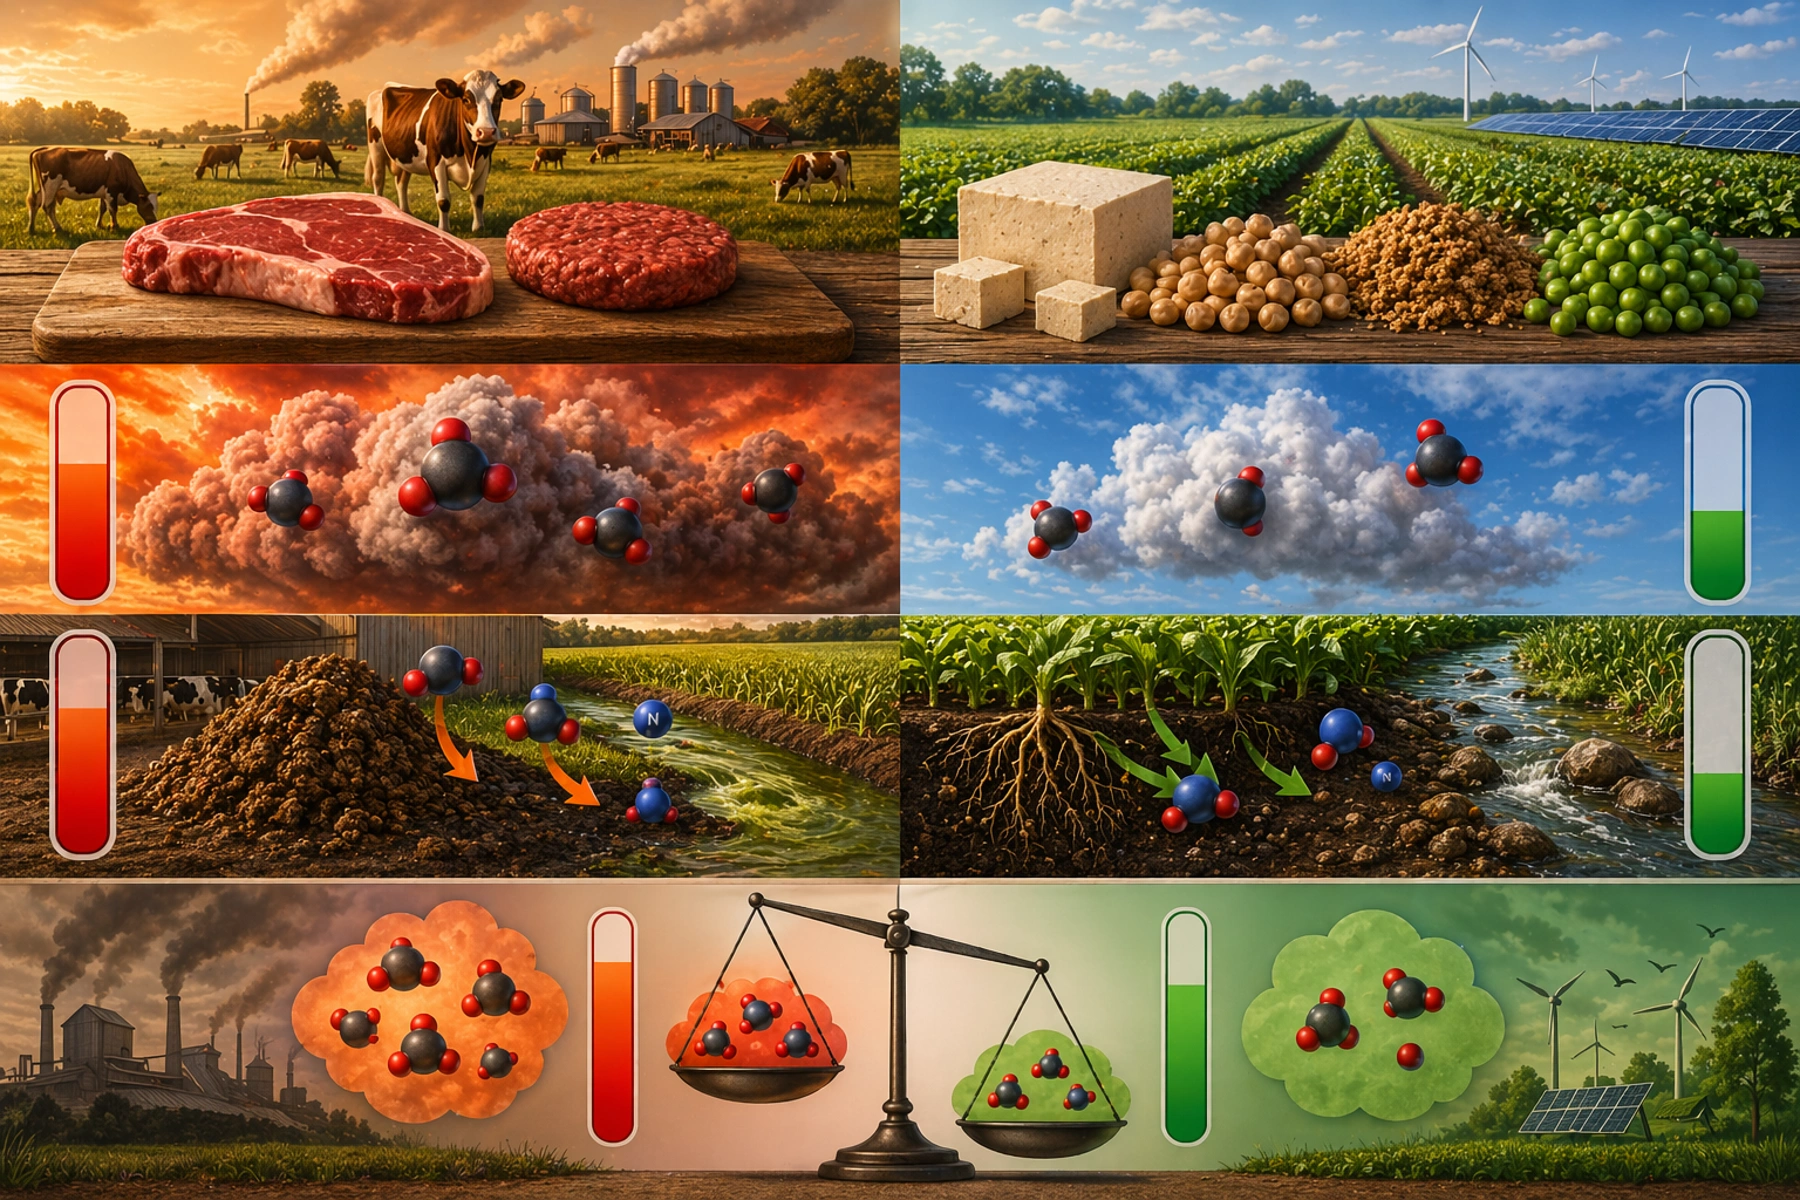
After deciding that all four are edible, each with its own pros and cons, it is time to see what effect the production of these products has on the environment and, more precisely, what greenhouse gases and nitrogen compounds are released so that these products can reach our refined palates.
First onto the field comes the player we blame for all the planet’s troubles, namely meat:
Main sources of greenhouse gases
Emissions from livestock come from three main mechanisms:
- Enteric fermentation — methane, CH₄
- Ruminant animals — cattle, sheep — produce methane during digestion
- Methane has about 28–34 times the warming potential of CO₂ on a 100-year scale
- Manure management — CH₄ + N₂O
- Anaerobic manure storage releases methane
- Nitrous oxide (N₂O) has about 265–298 times the warming potential of CO₂ — it is definitely not joking around
- Feed production + land-use change — CO₂ + N₂O
- Deforestation for pastures/soy feed, which reduces nature’s ability to process already existing CO₂
- N₂O emissions caused by fertilizers
- Often the geniuses who remove forests to create pastures in their place burn those trees, which releases additional amounts of CO₂ into the atmosphere
Quantitative emissions — per kg of product
Pretender | Greenhouse gas intensity (production) |
Beef | Very high |
Pork/chicken | High to medium |
Meat imitations | Low |
Whole grain substitutes | Very low |
Lab-grown meat | Varies |
Livestock contribution
Livestock as a whole contributes to:
- ~14–15% of global anthropogenic greenhouse gas emissions
- Cattle farming has the largest share
Beef is emissions-intensive because of:
- Feed conversion loss — 7–10 kg feed → 1 kg beef
- Methane production
- Expansion of land used for pastures and feed
After that, plant-based meat imitations enter the field:
Greenhouse gas profile
Meat imitations eliminate:
- Enteric methane
- Methane from manure
- Feed inefficiency
Main sources of emissions:
- Crop production
- Fertilizer — N₂O
- Processing energy — extrusion, isolation
Emission range
Category kg CO₂-eq. / kg product
Meat imitations 0.5–4.5
→ about 80–95% lower than beef
→ slightly higher than legumes because of processing
Then we include whole-food meat substitutes, such as legumes and peas.
Greenhouse gas mechanisms
Legumes:
- Biologically fix atmospheric nitrogen
- Require fewer synthetic fertilizers
- Do not produce methane
Emissions
Product kg CO₂-eq. / kg
Lentils 0.3–1.0
Beans 0.5–2
The lowest of all categories.
And finally, it is time for the still poorly known and not particularly popular participant — cultivated, or lab-grown, meat.
Emission profile
It does not produce:
- Enteric methane
- Manure emissions
- Deforestation
But on the other hand:
- It leads to very high electricity demand
- It requires production of growth media
- It requires sterile facilities
Expected emissions are highly variable:
- They may be 3–25 kg CO₂-eq./kg depending on the energy source
- Renewable energy would lead to a major reduction
- Energy from fossil fuels could potentially lead to an energy cost similar to pork production
The key variable is the carbon intensity of electricity.
You can see the summary of the contest in the table below
Pretender | Greenhouse gas intensity (production) |
Beef | Very high |
Pork/chicken | High to medium |
Meat imitations | Low |
Whole grain substitutes | Very low |
Lab-grown meat | Varies |
After looking at greenhouse gas emissions, it is time to pay attention to nitrogen emissions and their derivatives, which are:
- Ammonia (NH₃)
- Nitrous oxide (N₂O)
- Nitrate runoff (NO₃⁻)
- Eutrophication
Nitrogen “contribution” of livestock
Main sources
- Manure storage, during which ammonia evaporates
- Synthetic fertilizer for feed crops → N₂O
- Nitrate leaching into groundwater
- Runoff leading to dead zones — eutrophication
Livestock is responsible for:
- Most agricultural ammonia emissions in the EU
- A major driver of excessive nitrogen release
Nitrogen inefficiency:
Only about ~10–30% of the nitrogen animals eat ends up in meat.
Guess where the rest goes? Exactly — into the environment.
Nitrogen “contribution” of imitation meat products
Sources of nitrogen:
Fertilizer use in crops
Because of the way they are produced, there are no:
- Manure lagoons
- Concentrated ammonia emissions
Overall nitrogen pollution:
Significantly lower than livestock
Higher than whole-food substitutes because of crops grown for protein isolation
Now let us see how things look with whole-food and legume substitutes:
They have one key advantage:
Legumes naturally fix nitrogen through rhizobial bacteria.
Benefits:
- Reduced need for fertilizers
- Lower nitrate runoff
- Lower N₂O emissions
They can boast the lowest nitrogen footprint of all categories.
And as in the previous case, finally we will pay attention to the lesser-known player — lab-grown meat.
Benefits:
- No manure
- No runoff from grazing
But:
- Nitrogen is used in the production of growth media
- Upstream fertilizer footprint for glucose inputs
We can probably expect:
Lower nitrogen pollution than livestock.
It is still uncertain what its performance will be at industrial scale.
As with greenhouse gases, here too we will present a modest table containing the results of what we have discussed so far about nitrogen emissions:
Pretender | Nitrogen pollution |
Beef | Very high |
Pork | High |
Meat imitations | Low |
Whole grain substitutes | Very low |
Lab-grown meat | Probably low |
And after both rounds, it is time to announce the winners in the competition for the most polluting food products. Congratulations to the winners.
- Beef
- Pork
- Poultry
- Cultivated meat — energy-dependent
- Meat imitations
- Whole legumes
In conclusion, let us look at a scenario in which we want to get 100 g of protein per day and what that would cost in terms of greenhouse gas emissions:
Greenhouse gas emissions (kg CO₂-eq.)
Food type | 1 day | 1 week | 1 month | 1 year |
Lab-grown meat | 1.25 | 8.75 | 37.5 | 456.25 |
Meat (beef, that looks the scariest) | 49.89 | 349.23 | 1496.7 | 18209.85 |
Meat imitations | 2.06 | 14.41 | 61.76 | 751.47 |
Meat substitutes (peas/legumes) | 0.44 | 3.08 | 13.2 | 160.60 |
So we do not sound biased, we will leave you to look at the table and draw your own conclusions.
Sources:
https://ourworldindata.org/environmental-impacts-of-food
https://ourworldindata.org/food-choice-vs-eating-local
https://assets.ctfassets.net/hhv516v5f7sj/4exF7Ex74UoYku640WSF3t/cc213b148ee80fa2d8062e430012ec56/Impossible_foods_comparative_LCA.pdf
https://assets.ctfassets.net/hhv516v5f7sj/4exF7Ex74UoYku640WSF3t/cc213b148ee80fa2d8062e430012ec56/Impossible_foods_comparative_LCA.pdf
https://www.mdpi.com/2071-1050/14/23/16133
https://www.oecd.org/content/dam/oecd/en/publications/reports/2022/09/meat-protein-alternatives_54e42940/387d30cf-en.pdf
https://www.frontiersin.org/journals/nutrition/articles/10.3389/fnut.2025.1641234/full